When ranking the weakest link in an organization’s cybersecurity barriers, many tend to think of unpatched servers, exposed services or even shared resources on cloud providers. However, most overlook the number one factor needed for a successful cyberattack: humans.
Different attack vectors, such as phishing and stolen credentials, focus on employees as an initial entry point to a company. The 2018 Verizon Data Breach Investigations Report (DBIR), even states that “stolen credentials” are the most commonly used action in data breaches.
For these reasons, employee attack likelihood must be considered when assessing the cyber posture of an organization. But how can this be done?
Assessing the Human Factor
Human behavior affects employee attack likelihood. This human factor can be assessed by examining various elements, for example:
- Social posture
- Presence of security team
- Employee security awareness
Much like creating a company’s digital asset attack surface, we can also create an “employee attack surface”— a list of the company’s employees and their likelihood to be targeted for an attack.
Many components comprise the likelihood score; for example, employees in certain positions might be targeted because of what they can access. An executive may have access to sensitive information, a recruiter may interact with unauthenticated entities, an IT administrator may have extensive privileges, and so on.
Another primary source used by hackers is stolen credentials. Therefore, it’s important to identify leaked credentials for each employee and the different data classes that hackers can obtain about the employee. For example, if an employee’s password is available on a leaked data breach, this can be very attractive for hackers. As people tend to use the same passwords across multiple sites, hackers will often try to use passwords they find in leaked dumps to access company services.
At the end of the process, we can map the employee attack surface like so:

But can this really be used to measure the cyber posture of an organization?
The Red Flags of a Potential Data Breach
We recently investigated a data breach in a large consulting firm. The attacker gained access to the company’s webmail system using permutations on an account’s password that was available in a credential dump circulating on the dark web. The account did not have multi-factor authentication, which may have prevented the incident. The attack resulted in stolen confidential documents and emails, including those of clients of the firm.
We assessed the human factor of the consulting firm and compared it to different metrics to try and find correlations with the breach.
We took into consideration the following:
- The more employees a company has, the larger its attack surface will be.
- Older companies have a greater likelihood of having employee information available in breach dumps (even though the value of the dumps decreases as time passes).
We compared the consulting firm both to the general population of companies in the Panorays database and to a dataset of large-sized companies.
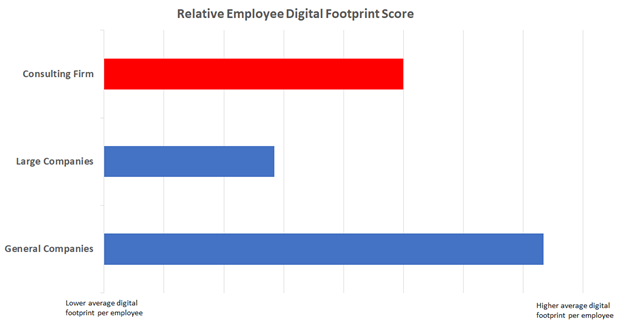 Figure 1: Relative employee digital footprint mean score
From figure 1 we can see that our consulting firm has a greater employee digital footprint compared to other large companies. This means that its employees have a wider web presence, giving attackers more information about the employees and points for interaction.
However, we can also see that the firms’ score is lower than the general company average. This makes sense, as smaller companies tend to have a larger relative digital footprint, since they are typically engaged in more marketing efforts. So the “digital footprint score” of the consulting firm is not irregular.
How Data Leaks Encourage Additional Data Leaks
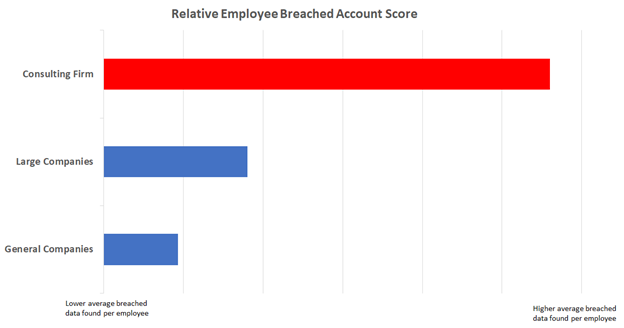
Figure 2: Relative breached accounts mean score
In figure 2, by contrast, we can see a strong indication of anomalous features in the consulting firm. The breached account score represents the presence of company employee information in known data leaks, including the data that an attacker can obtain from these breaches. This is actual updated breach data about current employees of the company. The consulting firm has three times more breach data than an average large company, and six times more breach data than general companies.
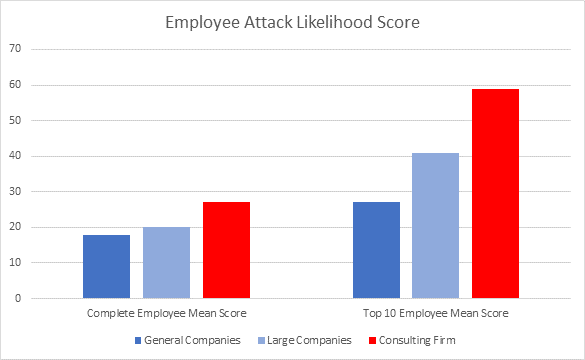
Figure 3: Employee Attack Likelihood Mean Score (entire company and top 10 employees)
Finally, we see the “Employee Attack Likelihood” score. This is a combined representation of the entire data collected about a company’s employees. For each company, we calculate the average rating of its entire employee force. Companies in the higher percentiles have a higher likelihood to be targeted for an attack. To identify companies that may have a small subset of employees with a high risk, we also calculate the average score of the top 10 employees most likely to be targeted for an attack.
In figure 3, we can see that the examined consulting firm has unusually high scores, both in the entire employee mean and in the top 10 employee mean. This data could have definitely raised a red flag for our consulting firm and possibly prevented the data breach.
But what can be done with this information?
The Road to Remediation
Managing employee risk is a complex task. Numerous mitigations that have become mandatory in today’s cyber climate include:
- Password complexity settings (such as how often to reset, what types of characters, etc.)
- Password management apps
- SSO and MFA support
- Identity management systems
- Behavior anomaly detection
- Security awareness programs
The first step is mapping your organization’s current cyber posture. Think of it as how hackers see your company. By understanding where you stand compared to your peers and what are your major gaps, you can build a plan around how not to be the next target of a cyber attack.
The Panorays Approach
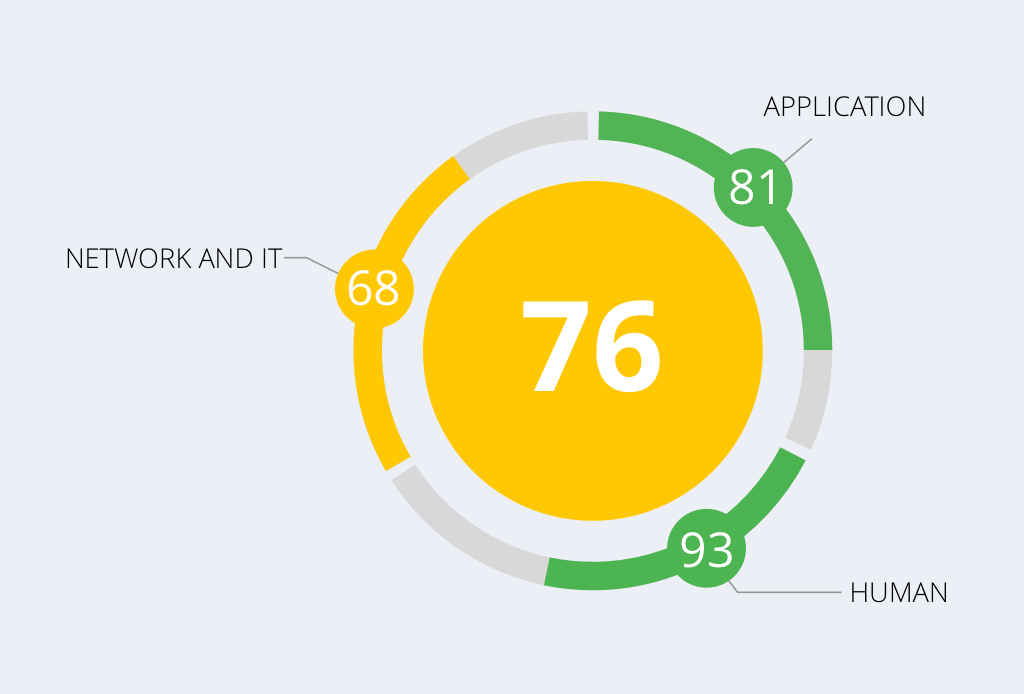
Panorays is the only solution that considers the human element when rating the cyber posture of companies for third-party security management.
For more information about Panorays’ human factor, contact us today.


